2018 College Basketball Preseason Rankings & Ratings
November 5, 2018 – by David Hess
Our 2018 college basketball preseason rankings were posted to the site on this weekend. Here’s a brief discussion of those rankings, as well as the full rankings and ratings for all 353 teams.
Who Is #1?
Like last season, a case can be made for a few different teams:
Duke has by far the highest-rated recruiting class of all time (more on this below), and returns roughly the same percent of its production it did last season (when it finished #2 in our ratings)Kansas has one of the highest-rated transfers in our database in Dedric Lawson, returns Udoka Azubuike to pair with Lawson and form perhaps the best frontcourt in the country, returns half of its defensive production, and has the 5th-rated recruiting class this year,North Carolina is is the second-highest-rated team from last season (after Virginia) that returns at least 60% of its production, plus has the 3rd-rated recruiting class this yearVirginia is the highest-rated team from last season that returns at least 60% of its productionNevada returns nearly 70% of its production from a team that made a Final Four run, plus has the third-rated incoming transfer class in our databaseTennessee is the highest-rated team from last season that returns at least 90% of its production
For our preseason projections, we rate the first four teams listed above as our top four teams. (Nevada is #7 and Tennessee is #8.) But there’s only a 0.9-point gap between #1 Duke and #4 Virginia — meaning we’d favor Duke over Virginia on a neutral court by less than a point. It’s close to a 4-way toss up at the top.
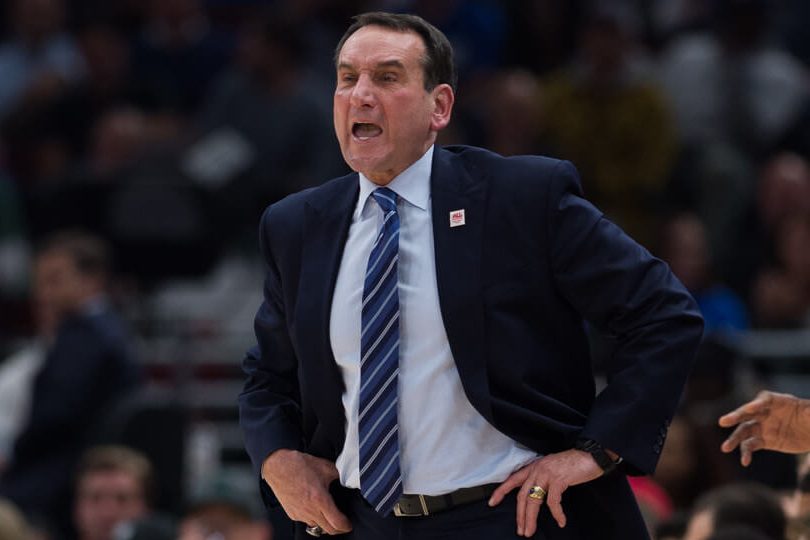
Duke’s Great Recruiting Class
We’re getting a little déjà vu with the Blue Devils. Last fall, Duke was our preseason #1 despite returning less than 20% of its production. That was mostly due to a phenomenal recruiting class, which at the time was the second-rated class in our database.
Well, this season Duke returns almost exactly the same percent of its production as last season (19% this year vs 18% last year), and has an even better recruiting class — the best one we’ve ever seen. Duke’s class includes the #1, #2, #4, and #13 ranked recruits according to the final RSCI consensus rankings.
Some of you may have seen preseason highlights of Duke’s incoming freshman Zion Williamson making highlight reel dunks and showing off great handles and a smooth jumper for a big man. He’s sparking articles with titles like There Has Never Been A Basketball Player Like Duke’s Zion Williamson. Aaaaand … he’s only the Blue Devils’ third-highest-rated recruit.
Let’s refresh the data we showed last season, highlighting the results of the other top recruiting classes in our database. Again, while not without hiccups, the overall performance has been very good. (If you are comparing this data to last season, please note that we made slight updates to our recruit ranking point-value scale, so the order of a couple teams has shifted.)
#1: 2018-19 Duke … ???#2: 2013-14 Kentucky … only an 8 seed, but lost in the title game#3: 2011-12 Kentucky … 38-2, national champs#4: 2017-18 Duke … #2 seed, lost in overtime in the regional final to #1 seed Kansas#5: 2013-14 Kansas … upset by Stanford in the second round … but they were missing Joel Embiid to injury, and obviously wouldn’t have been the #4 class without him#6: 2014-15 Duke … 35-4, national champs#7: 2016-17 Duke … upset in second round … 3 of the 4 main freshman missed several games, disappointing season overall, but still a #2 seed#8: 2006-07 Ohio State … 35-4, lost in title game to Florida, which was one of the greatest teams in recent history#9: 2005-06 Duke … 32-4, #1 seed, upset in Sweet 6#10: 2009-10 Kentucky … 35-2, #1 seed, lost in Elite 8
If Duke had actually returned a core of solid rotation players from last season, and added this class, they’d be the clear title favorite. As it stands, they’re still our #1, but by just a fraction of a point.
The Year Of The Transfer
Transfers are becoming more common every year, and it seems like this could be their breakout season. Half of our preseason top ten teams are projected to benefit heavily from incoming transfers this season.
When we make our projections, we come up with a point value for each transfer. In the seven seasons since we started calculating transfer values for preseason projections, we’ve projected six transfers to be worth at least 4 points. Three of them are playing for teams in the top 10 of our 2018 college basketball preseason rankings:
4.4 pts: Joe Cremo (to 2018-19 Villanova, from Albany)4.4 pts: Arsalan Kazemi (to 2013-14 Oregon, from Rice)4.4 pts: Damion Lee (to 2015-16 Louisville, from Drexel)4.4 pts: Trey Porter (to 2018-19 Nevada, from James Madison)4.2 pts: Dedric Lawson (to 2018-19 Kansas, from Memphis)4.1 pts: Stanton Kidd (to 2014-15 Colorado State, from NC Central)
If we expand the window to look at transfers projected to be worth 3 or more points, there are 27 players over the last seven years. Twelve (12) of them are joining teams this season. That includes two more players helping teams in our 2018 preseason top ten:
3.8 pts: Brandon Clarke (to 2018-19 Gonzaga, from San Jose State)3.2 pts: Reid Travis (to 2018-19 Kentucky, from Stanford)
Altogether, that means 5 of our 27 highest-rated transfers from the last seven years — nearly 20% of the biggest impact transfers in recent seasons — are joining teams in this season’s top 10. If the cards fall just right, we could see a Final Four where every team starts a major-impact transfer.
2018 College Basketball Preseason Rankings Method
To create our preseason rankings, we first establish a baseline prediction for a team, given its power ratings from recent years, and assuming an average amount of roster turnover. Then we make some adjustments based on how much value each team is returning on offense and defense, as well as the strength of its recruiting classes from the past few years, and the value of any transfers they’ve added this season. The result is our 2018 college basketball preseason rankings. For a more complete description, check out our blog post from five years ago.
As always, we’ve refit the model during the offseason, in order to take into account another year of data.
What Do We Use Them For?
The resulting ratings drive our preseason projections, and they serve as the Bayesian priors for our predictive ratings as the season progresses. (Translation: our preseason ratings still impact our team ratings even months into the season, because that has shown to be more predictive than not.)
Below you’ll find a preseason top 25 comparison between TeamRankings, Ken Pomeroy, Bart Torvik, ESPN’s BPI, the AP poll, and the ESPN Coaches poll. And at the end of the post you’ll see our full rankings and ratings for all 353 Division I teams.
Using these ratings, we’ve run full season projections, which are live on the site now. Go check’em out! Pages include:
College Basketball Projected Conference Standings. Projected conference records and full regular season records, plus win odds for both the conference regular season title and the postseason tournament.Bracketology Projections. Odds to make the NCAA tournament, plus projected seeding, and lots more details. (One of our faves is the Bracketology By Conference page.)NCAA Tournament Bracket Predictions. Round by round advancement odds, including probability of a team making the Sweet 16, making the Final Four, and winning the championship.
This is all data-driven, and automated, so it will update every morning throughout the season.
Ratings Accuracy
Before we get to the 2018 college basketball preseason rankings themselves, it’s worth noting that Ken Pomeroy and Dan Hanner have compared our preseason ratings and/or projections with other stat-based prognosticators in past years. Our finish has been consistently good, though also consistently a bit behind Dan Hanner’s bottom-up, player-based projections. (Links below go to the comparison blog posts from Ken and Dan.)
2017-18: 2nd of 7 (behind Hanner)2016-17: 4th of 7 (behind Torvik, Hanner, Gasaway)2015-16: 2nd of 7 (behind Hanner)2014-15: 2nd of 4 (behind Hanner)2013-14: 2nd of 4 (behind Hanner)2012-13: 1st of 3
Taking a few years of data into account, we feel we probably have the second best preseason ratings, behind Dan Hanner’s player lineup based projections, but ahead of Ken Pomeroy, ESPN, and human rankings.
We say this not to brag, but to try to preemptively defend ourselves against the inevitable “Team X is WAY too high/low! You don’t know what you’re doing!” comments. While these are by no means perfect rankings, the projections they drive have held their own in comparisons with other top projection systems. We expect them to do so again this season. We’re going to get plenty of individual teams wrong, but that’s inevitable when the challenge is to project 353 teams.
[Side note: Unfortunately, Dan Hanner has decided to retire from the preseason ratings game. In past seasons you could enjoy his preseason rankings and player projections at Sports Illustrated, but that is no longer the case.]
Preseason Top 25 Comparison
Let’s take a look at all the teams that made it into at least one preseason top 25 from among this group:
Our 2018-19 college basketball preseason ratings (TR)Ken Pomeroy’s preseason ratings (KP)Bart Torvik’s preseason ratings (BT)ESPN’s Basketball Power Index (BPI)AP poll (AP)Coaches poll (Coach)
The table below lists all such teams, and shows the preseason rank in each system. It also shows the average rank, and a column indicating how far TR is from the consensus. (Positive numbers mean we project a team to rank better than the consensus, and negative is the reverse.) For teams receiving no votes in the polls, we used a rank of 55. Teams are listed in ascending order by average rank.
| Team | TR | KP | BT | BPI | AP | Coaches | AVG | TR Diff |
|---|---|---|---|---|---|---|---|---|
| Kansas | 2 | 1 | 2 | 1 | 1 | 1 | 1.3 | -0.7 |
| Virginia | 4 | 4 | 1 | 3 | 5 | 5 | 3.7 | -0.3 |
| Duke | 1 | 2 | 3 | 11 | 4 | 3 | 4.0 | 3.0 |
| N Carolina | 3 | 3 | 6 | 2 | 8 | 7 | 4.8 | 1.8 |
| Kentucky | 5 | 7 | 5 | 9 | 2 | 2 | 5.0 | 0.0 |
| Gonzaga | 9 | 9 | 4 | 4 | 3 | 4 | 5.5 | -3.5 |
| Villanova | 6 | 5 | 13 | 6 | 9 | 8 | 7.8 | 1.8 |
| Tennessee | 8 | 11 | 12 | 5 | 6 | 6 | 8.0 | 0.0 |
| Nevada | 7 | 6 | 9 | 15 | 7 | 9 | 8.8 | 1.8 |
| Michigan St | 10 | 13 | 8 | 16 | 10 | 10 | 11.2 | 1.2 |
| W Virginia | 11 | 10 | 7 | 13 | 13 | 13 | 11.2 | 0.2 |
| Syracuse | 12 | 8 | 16 | 7 | 16 | 14 | 12.2 | 0.2 |
| Auburn | 15 | 17 | 14 | 20 | 11 | 12 | 14.8 | -0.2 |
| Kansas St | 20 | 12 | 18 | 17 | 12 | 11 | 15.0 | -5.0 |
| Florida St | 18 | 15 | 22 | 21 | 17 | 15 | 18.0 | 0.0 |
| Florida | 17 | 19 | 15 | 14 | 29 | 28 | 20.3 | 3.3 |
| Clemson | 16 | 14 | 32 | 18 | 22 | 23 | 20.8 | 4.8 |
| VA Tech | 31 | 22 | 21 | 19 | 15 | 17 | 20.8 | -10.2 |
| Miss State | 24 | 23 | 17 | 28 | 18 | 19 | 21.5 | -2.5 |
| Oregon | 23 | 27 | 11 | 39 | 14 | 16 | 21.7 | -1.3 |
| Michigan | 13 | 24 | 20 | 42 | 19 | 18 | 22.7 | 9.7 |
| Wisconsin | 21 | 20 | 24 | 8 | 32 | 42 | 24.5 | 3.5 |
| Marquette | 25 | 29 | 29 | 10 | 27 | 30 | 25.0 | 0.0 |
| Purdue | 14 | 18 | 42 | 36 | 24 | 22 | 26.0 | 12.0 |
| Miami (FL) | 19 | 21 | 10 | 34 | 40 | 47 | 28.5 | 9.5 |
| TX Christian | 41 | 34 | 31 | 43 | 20 | 21 | 31.7 | -9.3 |
| Texas Tech | 22 | 26 | 27 | 35 | 44 | 55 | 34.8 | 12.8 |
| Texas | 39 | 16 | 35 | 30 | 45 | 44 | 34.8 | -4.2 |
| Alabama | 51 | 51 | 23 | 26 | 35 | 33 | 36.5 | -14.5 |
| Nebraska | 35 | 38 | 40 | 55 | 30 | 25 | 37.2 | 2.2 |
| Iowa State | 26 | 25 | 33 | 33 | 55 | 55 | 37.8 | 11.8 |
| Iowa | 28 | 35 | 38 | 25 | 55 | 55 | 39.3 | 11.3 |
| Houston | 33 | 45 | 48 | 22 | 55 | 55 | 43.0 | 10.0 |
| Arizona St | 36 | 53 | 25 | 48 | 46 | 55 | 43.8 | 7.8 |
| Baylor | 38 | 40 | 77 | 12 | 55 | 46 | 44.7 | 6.7 |
| Washington | 54 | 46 | 53 | 67 | 25 | 24 | 44.8 | -9.2 |
| Northwestern | 59 | 57 | 45 | 24 | 55 | 55 | 49.2 | -9.8 |
| LSU | 61 | 50 | 74 | 65 | 23 | 26 | 49.8 | -11.2 |
| Seton Hall | 56 | 54 | 19 | 68 | 55 | 55 | 51.2 | -4.8 |
| UCLA | 48 | 47 | 83 | 97 | 21 | 20 | 52.7 | 4.7 |
| W Kentucky | 52 | 79 | 59 | 23 | 55 | 55 | 53.8 | 1.8 |
Preseason Top 25 Comparison Highlights
A few points stick out:
Three different teams are ranked #1: Kansas (Pomeroy, BPI, AP, Coaches), Duke (TeamRankings), and Virginia (Torvik).After Kansas at #1, there’s not much consensus. Kansas is ranked 1st or 2nd by every system. Every other team is ranked 5th or worse in by least one system.TeamRankings is the only ranking with Duke at #1. BPI, on the other hand, doesn’t even see Duke as a Top 10 team.The computers all rank North Carolina higher than the humans. The Tarheels seem similar to Wichita State last season, with a pretty high floor, but perhaps not a national title ceiling. Because most analytical projections are designed to forecast the average rating they expect a team to have if the season is played out millions of times, that high floor boosts UNC’s rating. AP Poll and Coaches Poll voters, on the other hand, are probably paying a bit more attention to ceilings, and less to floors.Pomeroy’s rankings have the highest correlation with the consensus, among the 39 teams listed here. BPI’s have the lowest. The rank order is: Pomeroy (0.926), TeamRankings (0.921), AP Poll (0.840), Torvik (0.831), Coaches Poll (0.818), BPI (0.725).BPI has several big outliers both in and outside of their Top 10. BPI has the most optimistic projections by far for Wisconsin (BPI #8, average #25) and Marquette (BPI #10, average #25). They also have Baylor at #12 when the average is #45. And they’re the only ranking with Duke (#11, average #4) or Nevada (#15, average #9) outside the top 10.We rank 5 teams at least 9 spots worse than consensus. We’re most pessimistic about Alabama (#51, average #37), followed by LSU (#61, average #50), Virginia Tech (#31, average #21), Northwestern (#59, average #49), and TCU (#41, average #32).We rank 7 team at least 10 spots better than consensus. From most optimistic to least: Texas Tech (#22, average #35), Purdue (#14, average #26), Iowa State (#26, average #38), Iowa (#28, average #39), Houston (#33, average #43), Michigan (#13, average #23), and Miami (#19, average #29).
Full 2018 College Basketball Preseason Rankings & Ratings, From #1 To #353
Below are our full 2018 college basketball preseason rankings.
Keep in mind that sometimes teams can be separated by several ranking spots, but have nearly identical ratings. On the flip side of the coin, two teams can be ranked adjacent to each other, but can have a big ratings gap.
Let’s look near the top of the rankings this season for an example. #10 Michigan State and #11 West Virginia are separated by 1.5 ratings points. That’s slightly larger than the difference between Michigan State and #5 Kentucky.
In other words, #10 Michigan State is closer to being #5 than they are #11.
| Rank | Team | Rating |
|---|---|---|
| 1 | Duke | 19.5 |
| 2 | Kansas | 19.2 |
| 3 | N Carolina | 18.6 |
| 4 | Virginia | 18.6 |
| 5 | Kentucky | 17.5 |
| 6 | Villanova | 17.4 |
| 7 | Nevada | 17.0 |
| 8 | Tennessee | 16.5 |
| 9 | Gonzaga | 16.4 |
| 10 | Michigan St | 16.1 |
| 11 | W Virginia | 14.6 |
| 12 | Syracuse | 14.6 |
| 13 | Michigan | 14.4 |
| 14 | Purdue | 14.3 |
| 15 | Auburn | 14.2 |
| 16 | Clemson | 14.2 |
| 17 | Florida | 14.2 |
| 18 | Florida St | 14.1 |
| 19 | Miami (FL) | 14.1 |
| 20 | Kansas St | 14.0 |
| 21 | Wisconsin | 14.0 |
| 22 | Texas Tech | 13.1 |
| 23 | Oregon | 12.8 |
| 24 | Miss State | 12.7 |
| 25 | Marquette | 12.6 |
| 26 | Iowa State | 12.3 |
| 27 | Indiana | 12.3 |
| 28 | Iowa | 12.2 |
| 29 | Cincinnati | 12.2 |
| 30 | Butler | 12.0 |
| 31 | VA Tech | 12.0 |
| 32 | St Johns | 11.9 |
| 33 | Houston | 11.8 |
| 34 | Creighton | 11.8 |
| 35 | Nebraska | 11.8 |
| 36 | Arizona St | 11.7 |
| 37 | Ohio State | 11.6 |
| 38 | Baylor | 11.3 |
| 39 | Texas | 11.3 |
| 40 | Maryland | 11.2 |
| 41 | TX Christian | 11.0 |
| 42 | San Diego St | 10.9 |
| 43 | NC State | 10.8 |
| 44 | Texas A&M | 10.8 |
| 45 | Xavier | 10.7 |
| 46 | Oklahoma | 10.7 |
| 47 | Notre Dame | 10.5 |
| 48 | UCLA | 10.4 |
| 49 | St Marys | 9.7 |
| 50 | Penn State | 9.4 |
| 51 | Alabama | 9.4 |
| 52 | W Kentucky | 9.3 |
| 53 | Georgetown | 9.2 |
| 54 | Washington | 9.2 |
| 55 | Louisville | 9.2 |
| 56 | Seton Hall | 9.2 |
| 57 | Providence | 9.2 |
| 58 | S Methodist | 9.2 |
| 59 | Northwestern | 9.0 |
| 60 | Northeastrn | 9.0 |
| 61 | LSU | 9.0 |
| 62 | BYU | 8.5 |
| 63 | S Carolina | 8.4 |
| 64 | Central FL | 8.4 |
| 65 | Wichita St | 8.4 |
| 66 | Buffalo | 8.3 |
| 67 | Davidson | 8.2 |
| 68 | USC | 8.0 |
| 69 | Arizona | 7.9 |
| 70 | Georgia | 7.8 |
| 71 | Montana | 7.7 |
| 72 | Missouri | 7.7 |
| 73 | Loyola-Chi | 7.3 |
| 74 | Temple | 7.3 |
| 75 | Fresno St | 7.1 |
| 76 | Illinois St | 6.9 |
| 77 | Minnesota | 6.9 |
| 78 | S Dakota St | 6.9 |
| 79 | Vanderbilt | 6.8 |
| 80 | Oklahoma St | 6.6 |
| 81 | LA Lafayette | 6.5 |
| 82 | Boston Col | 6.4 |
| 83 | Richmond | 6.3 |
| 84 | Oregon St | 6.3 |
| 85 | Utah | 6.2 |
| 86 | DePaul | 6.2 |
| 87 | Illinois | 6.2 |
| 88 | New Mexico | 6.0 |
| 89 | Harvard | 6.0 |
| 90 | UC Irvine | 5.9 |
| 91 | Arkansas | 5.9 |
| 92 | Connecticut | 5.9 |
| 93 | Colorado | 5.8 |
| 94 | Valparaiso | 5.7 |
| 95 | Dayton | 5.7 |
| 96 | Georgia St | 5.7 |
| 97 | Boise State | 5.7 |
| 98 | VCU | 5.6 |
| 99 | Old Dominion | 5.5 |
| 100 | Ste F Austin | 5.5 |
| 101 | U Penn | 5.5 |
| 102 | Middle Tenn | 5.4 |
| 103 | Rhode Island | 5.3 |
| 104 | Rider | 4.9 |
| 105 | N Mex State | 4.8 |
| 106 | Mississippi | 4.7 |
| 107 | Saint Louis | 4.6 |
| 108 | St Bonavent | 4.5 |
| 109 | Wofford | 4.4 |
| 110 | South Dakota | 4.3 |
| 111 | Tulsa | 4.3 |
| 112 | Wake Forest | 4.2 |
| 113 | Memphis | 4.0 |
| 114 | NC-Grnsboro | 4.0 |
| 115 | Marshall | 3.8 |
| 116 | N Iowa | 3.6 |
| 117 | UNLV | 3.3 |
| 118 | Toledo | 3.3 |
| 119 | Stanford | 3.2 |
| 120 | Yale | 3.1 |
| 121 | Ball State | 3.0 |
| 122 | Belmont | 3.0 |
| 123 | S Illinois | 2.9 |
| 124 | GA Tech | 2.9 |
| 125 | San Diego | 2.7 |
| 126 | Iona | 2.6 |
| 127 | Grand Canyon | 2.6 |
| 128 | Wm & Mary | 2.5 |
| 129 | Furman | 2.4 |
| 130 | Lipscomb | 2.3 |
| 131 | Col Charlestn | 2.3 |
| 132 | S Alabama | 2.2 |
| 133 | St Josephs | 2.2 |
| 134 | LA Tech | 2.2 |
| 135 | Rutgers | 2.1 |
| 136 | Hofstra | 2.1 |
| 137 | UC Davis | 2.1 |
| 138 | Pittsburgh | 2.1 |
| 139 | E Michigan | 2.0 |
| 140 | Murray St | 2.0 |
| 141 | Geo Mason | 1.9 |
| 142 | Vermont | 1.8 |
| 143 | UAB | 1.6 |
| 144 | Utah Val St | 1.4 |
| 145 | CS Fullerton | 1.4 |
| 146 | Canisius | 1.3 |
| 147 | Wright State | 1.2 |
| 148 | Bradley | 1.2 |
| 149 | San Fransco | 1.2 |
| 150 | Princeton | 1.1 |
| 151 | Missouri St | 0.9 |
| 152 | Northern Kentucky | 0.9 |
| 153 | North Texas | 0.8 |
| 154 | UCSB | 0.8 |
| 155 | Weber State | 0.7 |
| 156 | Monmouth | 0.7 |
| 157 | Utah State | 0.6 |
| 158 | Kent State | 0.6 |
| 159 | Bucknell | 0.4 |
| 160 | NC-Wilmgton | 0.3 |
| 161 | California | 0.2 |
| 162 | IPFW | 0.1 |
| 163 | GA Southern | 0.1 |
| 164 | E Tenn St | 0.1 |
| 165 | U Mass | 0.0 |
| 166 | Indiana St | -0.1 |
| 167 | Radford | -0.1 |
| 168 | E Washingtn | -0.2 |
| 169 | Fla Gulf Cst | -0.4 |
| 170 | Ohio | -0.5 |
| 171 | Evansville | -0.5 |
| 172 | Jksnville St | -0.5 |
| 173 | Pacific | -0.7 |
| 174 | Winthrop | -0.8 |
| 175 | App State | -0.9 |
| 176 | Loyola Mymt | -0.9 |
| 177 | Wyoming | -1.0 |
| 178 | Geo Wshgtn | -1.0 |
| 179 | N Colorado | -1.0 |
| 180 | James Mad | -1.1 |
| 181 | La Salle | -1.1 |
| 182 | North Dakota State | -1.2 |
| 183 | Lg Beach St | -1.3 |
| 184 | Duquesne | -1.4 |
| 185 | St Peters | -1.4 |
| 186 | Towson | -1.5 |
| 187 | Hawaii | -1.5 |
| 188 | TX-San Ant | -1.5 |
| 189 | Akron | -1.5 |
| 190 | Central Mich | -1.5 |
| 191 | Liberty | -1.8 |
| 192 | Lehigh | -1.8 |
| 193 | Drake | -1.9 |
| 194 | Austin Peay | -1.9 |
| 195 | St Fran (PA) | -2.0 |
| 196 | TX El Paso | -2.1 |
| 197 | Tulane | -2.1 |
| 198 | Troy | -2.1 |
| 199 | Colorado St | -2.2 |
| 200 | Wash State | -2.2 |
| 201 | LA Monroe | -2.2 |
| 202 | Delaware | -2.3 |
| 203 | Stony Brook | -2.4 |
| 204 | S Mississippi | -2.5 |
| 205 | N Illinois | -2.6 |
| 206 | CS Bakersfld | -2.7 |
| 207 | Denver | -2.9 |
| 208 | Morehead St | -2.9 |
| 209 | Brown | -3.0 |
| 210 | Miami (OH) | -3.1 |
| 211 | Columbia | -3.1 |
| 212 | IL-Chicago | -3.2 |
| 213 | Army | -3.3 |
| 214 | Texas State | -3.3 |
| 215 | Elon | -3.3 |
| 216 | Florida Intl | -3.4 |
| 217 | Hartford | -3.4 |
| 218 | Colgate | -3.4 |
| 219 | Lamar | -3.5 |
| 220 | Bowling Grn | -3.6 |
| 221 | New Jersey Tech | -3.7 |
| 222 | TX-Arlington | -3.9 |
| 223 | Nicholls St | -3.9 |
| 224 | Portland St | -3.9 |
| 225 | W Michigan | -4.0 |
| 226 | Oakland | -4.1 |
| 227 | WI-Grn Bay | -4.1 |
| 228 | N Florida | -4.2 |
| 229 | Wagner | -4.3 |
| 230 | Pepperdine | -4.4 |
| 231 | Coastal Car | -4.5 |
| 232 | Nebraska Omaha | -4.5 |
| 233 | High Point | -4.5 |
| 234 | Holy Cross | -4.6 |
| 235 | Mercer | -4.6 |
| 236 | Albany | -4.6 |
| 237 | Idaho State | -4.7 |
| 238 | Rob Morris | -4.7 |
| 239 | Maryland BC | -4.8 |
| 240 | Boston U | -4.8 |
| 241 | IUPUI | -4.9 |
| 242 | Air Force | -5.0 |
| 243 | TN State | -5.0 |
| 244 | Santa Clara | -5.0 |
| 245 | Fairfield | -5.0 |
| 246 | California Baptist | -5.1 |
| 247 | Hampton | -5.1 |
| 248 | Sam Hous St | -5.1 |
| 249 | Idaho | -5.2 |
| 250 | Niagara | -5.2 |
| 251 | TX Southern | -5.3 |
| 252 | LIU-Brooklyn | -5.3 |
| 253 | Quinnipiac | -5.4 |
| 254 | Seattle | -5.4 |
| 255 | WI-Milwkee | -5.4 |
| 256 | TN Martin | -5.4 |
| 257 | Fordham | -5.6 |
| 258 | Portland | -5.6 |
| 259 | Cornell | -5.7 |
| 260 | Campbell | -5.7 |
| 261 | S Florida | -5.8 |
| 262 | AR Lit Rock | -5.8 |
| 263 | Norfolk St | -5.9 |
| 264 | Abilene Christian | -5.9 |
| 265 | Navy | -6.0 |
| 266 | UC Riverside | -6.0 |
| 267 | Siena | -6.1 |
| 268 | Gard-Webb | -6.3 |
| 269 | SE Louisiana | -6.3 |
| 270 | Charl South | -6.3 |
| 271 | NC-Asheville | -6.4 |
| 272 | Sac State | -6.4 |
| 273 | UMKC | -6.5 |
| 274 | TN Tech | -6.5 |
| 275 | Fla Atlantic | -6.5 |
| 276 | American | -6.6 |
| 277 | Cleveland St | -6.6 |
| 278 | Dartmouth | -6.7 |
| 279 | North Dakota | -6.9 |
| 280 | Cal Poly | -6.9 |
| 281 | F Dickinson | -6.9 |
| 282 | Marist | -7.0 |
| 283 | Oral Roberts | -7.0 |
| 284 | McNeese St | -7.1 |
| 285 | Montana St | -7.1 |
| 286 | E Kentucky | -7.1 |
| 287 | Manhattan | -7.2 |
| 288 | Charlotte | -7.3 |
| 289 | NC Central | -7.3 |
| 290 | Arkansas St | -7.3 |
| 291 | Lafayette | -7.3 |
| 292 | TX A&M-CC | -7.4 |
| 293 | New Orleans | -7.5 |
| 294 | SE Missouri | -7.6 |
| 295 | Jacksonville | -7.8 |
| 296 | Central Ark | -7.9 |
| 297 | Drexel | -8.0 |
| 298 | Samford | -8.1 |
| 299 | Howard | -8.2 |
| 300 | E Carolina | -8.2 |
| 301 | Chattanooga | -8.2 |
| 302 | N Hampshire | -8.2 |
| 303 | Binghamton | -8.2 |
| 304 | Grambling St | -8.5 |
| 305 | W Carolina | -8.5 |
| 306 | Citadel | -8.5 |
| 307 | S Utah | -8.5 |
| 308 | Prairie View | -8.8 |
| 309 | W Illinois | -8.9 |
| 310 | E Illinois | -8.9 |
| 311 | Beth-Cook | -9.0 |
| 312 | Loyola-MD | -9.2 |
| 313 | Massachusetts Lowell | -9.3 |
| 314 | Houston Bap | -9.6 |
| 315 | Sacred Hrt | -9.7 |
| 316 | St Fran (NY) | -9.8 |
| 317 | Rice | -9.8 |
| 318 | SIU Edward | -9.9 |
| 319 | TX-Pan Am | -10.0 |
| 320 | VA Military | -10.1 |
| 321 | Youngs St | -10.3 |
| 322 | Central Conn | -10.4 |
| 323 | Bryant | -10.6 |
| 324 | Southern | -10.7 |
| 325 | N Arizona | -10.7 |
| 326 | Detroit | -10.8 |
| 327 | San Jose St | -10.9 |
| 328 | Alabama St | -11.1 |
| 329 | Kennesaw St | -11.5 |
| 330 | Presbyterian | -11.5 |
| 331 | Jackson St | -11.7 |
| 332 | Morgan St | -12.1 |
| 333 | Maine | -12.2 |
| 334 | South Carolina Upstate | -12.3 |
| 335 | Ark Pine Bl | -12.3 |
| 336 | Mt St Marys | -12.5 |
| 337 | Cal St Nrdge | -12.9 |
| 338 | Incarnate Word | -13.2 |
| 339 | NW State | -13.3 |
| 340 | Stetson | -13.4 |
| 341 | Maryland ES | -13.6 |
| 342 | North Alabama | -13.7 |
| 343 | Longwood | -13.8 |
| 344 | S Car State | -14.2 |
| 345 | NC A&T | -14.6 |
| 346 | Chicago St | -14.8 |
| 347 | Miss Val St | -15.1 |
| 348 | Coppin State | -15.6 |
| 349 | Alcorn State | -15.6 |
| 350 | Savannah St | -15.6 |
| 351 | Alab A&M | -17.1 |
| 352 | Delaware St | -17.4 |
| 353 | Florida A&M | -17.6 |
Before You Go …
As a final reminder, be sure to check out the season projections we create using these 2018 college basketball preseason rankings. There’s a ton to see:
College Basketball Projected Conference Standings. Projected conference records and full regular season records, plus win odds for both the conference regular season title and the postseason tournament.Bracketology Projections. Odds to make the NCAA tournament, plus projected seeding, and lots more details.NCAA Tournament Bracket Predictions. Round by round advancement odds, including probability of a team making the Sweet 16, making the Final Four, and winning the championship.
If you liked this post, please share it. Thank you! Twitter Facebook
NFL Football Pool Picks NFL Survivor Pool Picks NCAA Bracket Picks College Bowl Pool Picks College Football Pool Picks NFL Picks NBA Picks MLB Picks College Football Picks College Basketball Picks NFL Predictions NBA Predictions MLB Predictions College Football Predictions College Basketball Predictions NFL Spread Picks NBA Spread Picks MLB Spread Picks College Football Spread Picks College Basketball Spread Picks NFL Rankings NBA Rankings MLB Rankings College Football Rankings College Basketball Rankings NFL Stats NBA Stats MLB Stats College Football Stats College Basketball Stats NFL Odds NBA Odds MLB Odds College Football Odds College Basketball Odds A product ofTeamRankings BlogAboutTeamJobsContact
© 2005-2024 Team Rankings, LLC. All Rights Reserved. Statistical data provided by Gracenote.
TeamRankings.com is not affiliated with the National Collegiate Athletic Association (NCAA®) or March Madness Athletic Association, neither of which has supplied, reviewed, approved or endorsed the material on this site. TeamRankings.com is solely responsible for this site but makes no guarantee about the accuracy or completeness of the information herein.
Terms of ServicePrivacy Policy