Preseason Bracketology: 2020 NCAA Tournament Bracket
November 4, 2019 – by David Hess
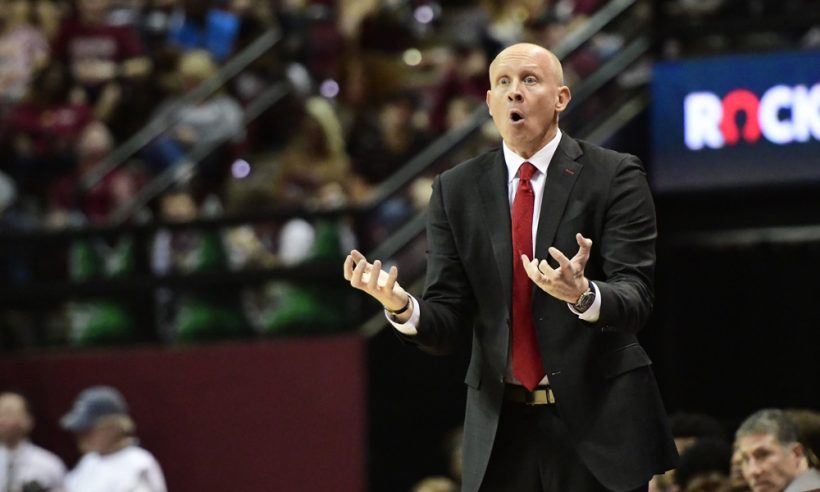
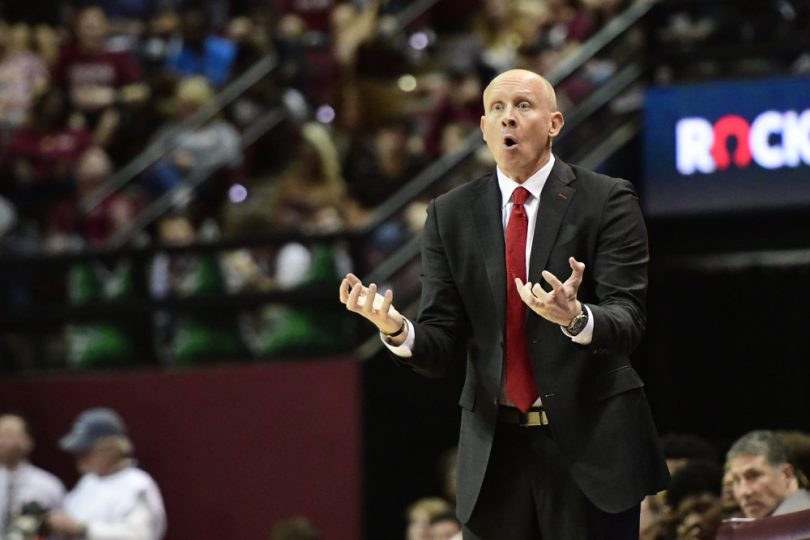
Chris Mack, excited we’re projecting his Louisville Cardinals as a 1 seed. (Photo by David Allio/Icon Sportswire)
It’s College Basketball Season Eve! Put this gift under your tree: 2020 NCAA tournament bracketology predictions.
How Did We Do Last Year?
Before we get to the preseason 2020 bracket, let’s recap how last year’s preseason bracketology predictions did.
3 of 4 top seeds correct. Our projected No. 1 seeds last year were Kansas, Duke, Gonzaga and Virginia. All but Kansas ended up as No. 1 seeds in the actual tournament.21 of 23 conferences projected correctly as one-bid. We projected the Atlantic 10 and Ohio Valley as one-bid conferences, but they both ended up sending two teams.8 of 21 one-bid conference champs correct. Based on our projected conference tournament win odds, we expected to get an average of 9.3 correct, so 8 is well within the expected range. The distribution of hits and misses was a little strange. We missed all six 16 seeds, but got 8 of 15 correct for the rest of the one-bid conferences.33 of 45 at-large quality teams correct. We projected 45 teams above the at-large cutoff line (36 at larges, and 9 projected conference champs). 33 made the tournament. Based on our projected chance to reach the tournament, we’d have expected only about 28 teams to make it, so this was a little better than expected.3 projected top 4 seeds missed the tournament. This is exactly in line with the expectation based on our projected tourney bid odds. The teams we missed were Clemson (3), West Virginia (3) and Miami (4), who were all projected with less than a 70% chance to reach the tournament.1 actual top 4 seed wasn’t in our bracket: LSU (3) was originally projected with only a 5% chance to make the tournament.29 of 42 teams within two seed lines. Of teams that we correctly projected in the tournament, 9 had the exact seed correct, 11 were off by one seed, 9 were off by two, and 13 were off by between three and seven seed lines.
We weren’t perfect, but we didn’t expect to be. The teams in our bracket reached the tournament slightly more often than we expected, and our projections were better for the at-large quality teams than for the automatic bids. Overall, we think we did pretty well, for November!
Now, on to the 2020 bracket.
Projected No. 1 Seeds
Here are our projected #1 seeds in the 2020 NCAA tournament:
Michigan State (40% chance)Kentucky (38% chance)Gonzaga (30% chance)Louisville (29% chance)
Michigan State is the clear top team in our preseason ratings, almost two points ahead of the second place team (that’s a big difference for a single place in the rankings), so having them as the overall top seed on our bracket makes complete sense.
Kentucky is the second place team in those ratings, so the Wildcats having the second highest one-seed odds is also unexpected. Their odds being nearly as high as Michigan State’s at first is a little surprising. But the SEC isn’t as deep through the whole conference as the Big Ten or Big 12, nor does it have a cluster of several potentially great teams like the ACC. So Kentucky is more likely to make it through their conference season with a gaudy record, which would be rewarded by the selection committee.
Gonzaga on the third line is more surprising, as they are only #7 in our preseason ratings. Wait, this sounds familiar. Check out what we wrote last year about the Zags:
Gonzaga on the third line is more surprising, as they are only #9 in our preseason ratings. Once you examine their schedule it makes more sense. They are expected to roll through the WCC, and are projected to enter the NCAA tournament with the fewest losses in the country, tied with Nevada. But while Nevada plays a nonconference schedule devoid of top ranked teams, the Zags have a couple chances to notch great wins (at UNC, vs. Tennessee).
Indeed, Gonzaga entered the tournament with only 3 losses, tied for the fewest (with Buffalo, Houston and Virginia), notched a great win over Duke in non-conference play, and nabbed a top seed. Their playbook is the same this season.
Louisville as the fourth No. 1 seed … now that one is intriguing. We rank the top of the ACC as (with predictive ranking): Duke (3), Louisville (5) and North Carolina (6). Yet Duke is projected with only 28% top seed odds, compared to Louisville’s 29% (and it’s not just a simulation noise thing — we’ve re-run this several times).
It’s tough to say for sure since our model doesn’t produce reasons, only numbers, but we suspect Duke’s non-conference schedule may be working against them. Duke plays two marquee games against Kansas and Michigan State … and nobody else that should threaten them. There’s a pretty reasonable chance of going 0-2 in those games and having their non-conference resume be a big fat zero, in terms of good wins. Louisville only has one truly marquee matchup (Kentucky) compared to Duke’s two, but plays several more non-cupcake opponents (Texas Tech, Michigan … even Western Kentucky counts here, compared to Duke’s schedule). They’re more likely to get something positive from their non-conference slate.
Regardless of the reason, 29% vs 28% is not a big difference. Throw in North Carolina at 18%, and the model is basically saying that the best team in the ACC will likely get a No. 1 seed.
Of course, we have more than just #1 seeds. On to the bracket!
Preseason Bracketology: 2020 Projected NCAA Tournament Bracket
(click to enlarge)
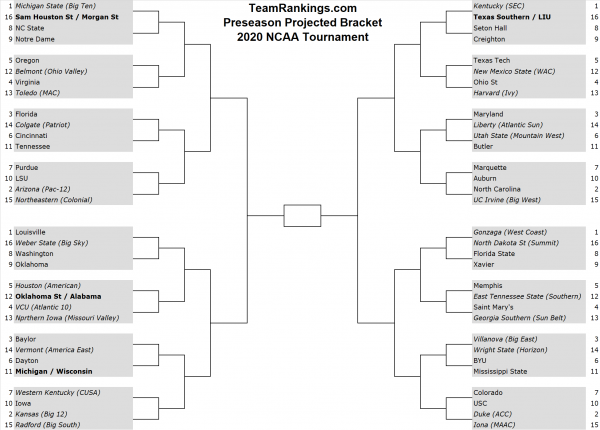
[Note: We’re not worried about following the NCAA’s bracketing rules here. We know that, for example, NC State shouldn’t play Notre Dame in the first round. Our goal here is to show expected seed lines for each team, and give an idea of the rough quality of opponent they might face in each round. Trying to predict actual bracket matchups at this point is silly.]
For details on how this bracket was created, see our original Madness Strikes November blog post. That post goes into more detail, but the basic idea is:
Simulate the regular seasonSeed & play out conference tournamentsSimulate NCAA tournament selection and seeding
Preseason Bracketology 2020: Odds For All 353 Teams
Our selection & seeding model doesn’t directly produce the single bracket you see above. Its output is actually a set of odds describing each team’s chance to make the NCAA tournament, and to earn each specific seed (among other info). The bracket is created at the end, based on those odds.
What does that mean for you? It means you get to see lots of juicy data, if you so desire.
Here are our official 2020 NCAA Tournament preseason projected bracketology odds for every team. For a sortable table of similar odds that we update daily, check out our NCAA Bracketology detail page.
And, even cooler, to see projected round by round NCAA Tournament advancement odds based on our simulated brackets, check out our NCAA Tournament Bracket Predictions.
| TR Bracket Seed | Team | Bid | Auto | At Large | Avg Seed If In | 1-4 Seed | 1 Seed |
|---|---|---|---|---|---|---|---|
| 1 | Michigan St | 98% | 39% | 59% | 2.8 | 80% | 40% |
| 1 | Kentucky | 96% | 34% | 62% | 3.1 | 75% | 38% |
| 1 | Gonzaga | 94% | 51% | 43% | 3.5 | 67% | 30% |
| 1 | Louisville | 94% | 23% | 72% | 3.6 | 66% | 29% |
| 2 | Kansas | 96% | 33% | 62% | 3.5 | 69% | 28% |
| 2 | Duke | 94% | 25% | 69% | 3.6 | 67% | 26% |
| 2 | N Carolina | 92% | 19% | 73% | 4.3 | 58% | 18% |
| 2 | Arizona | 80% | 24% | 56% | 5.1 | 41% | 12% |
| 3 | Florida | 88% | 20% | 68% | 4.9 | 47% | 11% |
| 3 | Maryland | 83% | 14% | 69% | 5.2 | 41% | 11% |
| 3 | Villanova | 80% | 21% | 58% | 5.5 | 37% | 9% |
| 3 | Baylor | 79% | 17% | 62% | 5.6 | 35% | 9% |
| 4 | VCU | 77% | 31% | 46% | 5.4 | 35% | 7% |
| 4 | St Marys | 74% | 24% | 50% | 5.6 | 31% | 7% |
| 4 | Ohio State | 78% | 11% | 68% | 5.8 | 33% | 9% |
| 4 | Virginia | 74% | 10% | 64% | 5.7 | 31% | 6% |
| 5 | Oregon | 69% | 17% | 52% | 6.1 | 27% | 5% |
| 5 | Texas Tech | 74% | 15% | 59% | 5.9 | 29% | 7% |
| 5 | Memphis | 64% | 20% | 44% | 6.2 | 24% | 5% |
| 5 | Houston | 67% | 20% | 46% | 6.3 | 23% | 3% |
| 6 | Dayton | 62% | 22% | 40% | 6.3 | 22% | 3% |
| 6 | BYU | 70% | 19% | 51% | 6.5 | 22% | 3% |
| 6 | Utah State | 68% | 38% | 31% | 6.3 | 24% | 3% |
| 6 | Cincinnati | 64% | 19% | 45% | 6.7 | 20% | 3% |
| 7 | Purdue | 67% | 8% | 59% | 6.3 | 23% | 4% |
| 7 | Marquette | 64% | 14% | 50% | 6.5 | 21% | 4% |
| 7 | Colorado | 60% | 14% | 46% | 6.6 | 19% | 3% |
| 7 | W Kentucky | 64% | 43% | 20% | 7.1 | 16% | 1% |
| 8 | Washington | 57% | 12% | 44% | 6.6 | 18% | 3% |
| 8 | Florida St | 66% | 7% | 59% | 6.6 | 20% | 4% |
| 8 | Seton Hall | 66% | 15% | 51% | 6.7 | 20% | 3% |
| 8 | NC State | 52% | 5% | 47% | 6.8 | 14% | 3% |
| 9 | Notre Dame | 44% | 4% | 40% | 7.1 | 10% | 2% |
| 9 | Creighton | 54% | 11% | 43% | 6.8 | 16% | 3% |
| 9 | Xavier | 57% | 11% | 46% | 6.8 | 18% | 3% |
| 9 | Oklahoma | 61% | 9% | 52% | 7.0 | 17% | 3% |
| 10 | Iowa | 44% | 4% | 40% | 7.4 | 9% | 1% |
| 10 | USC | 48% | 10% | 38% | 7.2 | 12% | 1% |
| 10 | Auburn | 61% | 6% | 55% | 6.9 | 18% | 3% |
| 10 | LSU | 64% | 7% | 57% | 6.9 | 19% | 3% |
| 11 | Tennessee | 54% | 6% | 48% | 7.2 | 14% | 2% |
| 11 | Butler | 48% | 9% | 39% | 7.4 | 12% | 2% |
| 11 | Miss State | 49% | 4% | 44% | 7.4 | 12% | 2% |
| 11 | Michigan | 49% | 4% | 45% | 7.7 | 10% | 1% |
| 11 | Wisconsin | 56% | 4% | 52% | 7.6 | 13% | 1% |
| 12 | Oklahoma St | 46% | 6% | 41% | 7.8 | 10% | 1% |
| 12 | Alabama | 60% | 6% | 54% | 7.5 | 14% | 2% |
| 12 | E Tenn St | 55% | 40% | 15% | 8.1 | 9% | 1% |
| 12 | N Mex State | 65% | 60% | 5% | 9.4 | 6% | 0% |
| 12 | Belmont | 59% | 56% | 3% | 10.4 | 3% | 0% |
| 13 | Toledo | 25% | 19% | 6% | 10.5 | 1% | 0% |
| 13 | Harvard | 54% | 49% | 4% | 10.7 | 3% | 0% |
| 13 | GA Southern | 26% | 22% | 4% | 11.3 | 1% | 0% |
| 13 | N Iowa | 21% | 16% | 5% | 11.4 | 1% | 0% |
| 14 | Vermont | 59% | 58% | 1% | 12.1 | 1% | 0% |
| 14 | Wright State | 33% | 31% | 1% | 12.4 | 0% | 0% |
| 14 | Liberty | 50% | 49% | 0% | 12.8 | 0% | 0% |
| 14 | Colgate | 33% | 32% | 0% | 13.2 | 0% | 0% |
| 15 | Northeastrn | 23% | 22% | 1% | 13.0 | 0% | 0% |
| 15 | UC Irvine | 26% | 25% | 1% | 13.7 | 0% | 0% |
| 15 | Iona | 34% | 34% | 0% | 13.9 | 0% | 0% |
| 15 | Radford | 34% | 34% | 0% | 14.1 | 0% | 0% |
| 16 | Weber State | 19% | 19% | 0% | 14.6 | 0% | 0% |
| 16 | N Dakota St | 20% | 20% | 0% | 14.3 | 0% | 0% |
| 16 | TX Southern | 28% | 28% | 0% | 15.7 | 0% | 0% |
| 16 | Sam Hous St | 22% | 22% | 0% | 15.0 | 0% | 0% |
| 16 | Morgan St | 20% | 20% | 0% | 15.9 | 0% | 0% |
| 16 | LIU | 41% | 41% | 0% | 14.6 | 0% | 0% |
| Davidson | 48% | 17% | 31% | 7.4 | 10% | 1% | |
| Wichita St | 43% | 11% | 32% | 7.4 | 10% | 1% | |
| Texas | 42% | 5% | 38% | 8.0 | 8% | 1% | |
| Iowa State | 42% | 6% | 36% | 7.4 | 9% | 2% | |
| Indiana | 41% | 4% | 38% | 7.4 | 9% | 1% | |
| Georgetown | 41% | 7% | 34% | 7.5 | 10% | 2% | |
| UCLA | 40% | 7% | 33% | 7.8 | 8% | 1% | |
| Illinois | 40% | 3% | 37% | 8.1 | 7% | 1% | |
| Providence | 40% | 7% | 33% | 7.6 | 8% | 1% | |
| Arkansas | 38% | 3% | 35% | 7.9 | 7% | 1% | |
| Missouri | 37% | 4% | 33% | 7.7 | 7% | 1% | |
| Penn State | 37% | 4% | 33% | 7.4 | 7% | 1% | |
| Texas A&M | 36% | 4% | 33% | 7.5 | 8% | 1% | |
| TX Christian | 33% | 4% | 30% | 8.0 | 6% | 1% | |
| Kansas St | 33% | 4% | 29% | 8.1 | 6% | 1% | |
| Georgia | 32% | 3% | 29% | 8.2 | 5% | 1% | |
| Rutgers | 31% | 2% | 29% | 7.8 | 5% | 1% | |
| Mississippi | 30% | 2% | 28% | 8.4 | 5% | 1% | |
| Syracuse | 30% | 2% | 28% | 7.9 | 5% | 1% | |
| Rhode Island | 29% | 9% | 19% | 8.7 | 3% | 0% | |
| Richmond | 27% | 9% | 19% | 8.3 | 4% | 0% | |
| Arizona St | 26% | 5% | 22% | 8.5 | 4% | 0% | |
| Temple | 26% | 7% | 19% | 8.6 | 3% | 0% | |
| Miami (FL) | 24% | 1% | 23% | 9.1 | 2% | 0% | |
| Connecticut | 23% | 6% | 17% | 8.5 | 3% | 0% | |
| Col Charlestn | 23% | 22% | 1% | 12.9 | 0% | 0% | |
| Prairie View | 23% | 23% | 0% | 15.8 | 0% | 0% | |
| Boise State | 23% | 12% | 11% | 9.1 | 2% | 0% | |
| Bucknell | 22% | 22% | 0% | 13.6 | 0% | 0% | |
| UCSB | 22% | 22% | 0% | 14.1 | 0% | 0% | |
| San Diego St | 22% | 11% | 12% | 9.3 | 2% | 0% | |
| Oregon St | 22% | 5% | 17% | 8.2 | 3% | 0% | |
| Murray St | 22% | 21% | 1% | 13.0 | 0% | 0% | |
| Clemson | 21% | 1% | 20% | 8.3 | 3% | 0% | |
| Furman | 21% | 16% | 5% | 10.7 | 1% | 0% | |
| Nebraska | 21% | 2% | 19% | 8.4 | 3% | 0% | |
| S Alabama | 21% | 19% | 2% | 12.1 | 0% | 0% | |
| Rider | 20% | 20% | 0% | 14.7 | 0% | 0% | |
| S Florida | 20% | 5% | 15% | 8.3 | 3% | 0% | |
| Hofstra | 19% | 19% | 1% | 13.2 | 0% | 0% | |
| South Dakota | 19% | 19% | 0% | 14.3 | 0% | 0% | |
| Montana | 19% | 19% | 0% | 14.7 | 0% | 0% | |
| N Florida | 19% | 19% | 0% | 14.1 | 0% | 0% | |
| Gard-Webb | 19% | 19% | 0% | 14.7 | 0% | 0% | |
| Loyola-Chi | 19% | 16% | 3% | 11.6 | 1% | 0% | |
| Missouri St | 19% | 16% | 3% | 12.0 | 0% | 0% | |
| W Virginia | 19% | 2% | 17% | 9.4 | 1% | 0% | |
| TX-Arlington | 19% | 16% | 3% | 12.1 | 0% | 0% | |
| NC-Grnsboro | 18% | 14% | 5% | 10.8 | 1% | 0% | |
| Pittsburgh | 18% | 1% | 17% | 8.4 | 2% | 0% | |
| Minnesota | 18% | 1% | 17% | 9.0 | 2% | 0% | |
| U Penn | 17% | 14% | 3% | 11.9 | 0% | 0% | |
| New Mexico | 17% | 9% | 8% | 9.3 | 2% | 0% | |
| Yale | 17% | 13% | 4% | 12.0 | 0% | 0% | |
| Ball State | 17% | 13% | 4% | 11.1 | 1% | 0% | |
| Neb Omaha | 17% | 17% | 0% | 14.4 | 0% | 0% | |
| LA Tech | 16% | 12% | 4% | 11.1 | 0% | 0% | |
| Nevada | 16% | 8% | 8% | 9.9 | 1% | 0% | |
| IL-Chicago | 16% | 15% | 0% | 13.6 | 0% | 0% | |
| S Methodist | 16% | 5% | 11% | 8.8 | 2% | 0% | |
| S Car State | 16% | 16% | 0% | 15.9 | 0% | 0% | |
| Buffalo | 15% | 11% | 4% | 11.1 | 1% | 0% | |
| Grd Canyon | 15% | 14% | 1% | 13.2 | 0% | 0% | |
| Stony Brook | 15% | 14% | 0% | 14.4 | 0% | 0% | |
| N Kentucky | 15% | 14% | 0% | 13.7 | 0% | 0% | |
| Albany | 14% | 14% | 0% | 14.3 | 0% | 0% | |
| Bowling Grn | 14% | 11% | 4% | 11.3 | 0% | 0% | |
| Hawaii | 14% | 14% | 0% | 14.5 | 0% | 0% | |
| UNLV | 14% | 11% | 3% | 11.5 | 1% | 0% | |
| Drake | 14% | 12% | 2% | 12.2 | 0% | 0% | |
| Akron | 14% | 12% | 3% | 11.7 | 0% | 0% | |
| Fresno St | 14% | 8% | 6% | 10.1 | 1% | 0% | |
| St Johns | 14% | 2% | 11% | 8.6 | 2% | 0% | |
| Beth-Cook | 14% | 14% | 0% | 15.9 | 0% | 0% | |
| S Carolina | 13% | 1% | 12% | 8.7 | 1% | 0% | |
| Towson | 13% | 13% | 1% | 13.8 | 0% | 0% | |
| N Colorado | 13% | 13% | 0% | 15.0 | 0% | 0% | |
| Samford | 13% | 11% | 2% | 11.7 | 0% | 0% | |
| Tulsa | 13% | 4% | 10% | 9.0 | 1% | 0% | |
| McNeese St | 13% | 13% | 0% | 15.4 | 0% | 0% | |
| Oral Roberts | 12% | 12% | 0% | 14.7 | 0% | 0% | |
| Hampton | 12% | 12% | 0% | 14.9 | 0% | 0% | |
| Wofford | 12% | 10% | 2% | 12.1 | 0% | 0% | |
| Sacred Hrt | 12% | 12% | 0% | 15.4 | 0% | 0% | |
| St Fran (PA) | 12% | 12% | 0% | 15.4 | 0% | 0% | |
| Indiana St | 12% | 10% | 2% | 12.3 | 0% | 0% | |
| Norfolk St | 12% | 12% | 0% | 16.0 | 0% | 0% | |
| Grambling St | 12% | 12% | 0% | 15.9 | 0% | 0% | |
| NC Central | 12% | 12% | 0% | 15.9 | 0% | 0% | |
| Oakland | 12% | 12% | 0% | 14.1 | 0% | 0% | |
| Lipscomb | 12% | 12% | 0% | 14.6 | 0% | 0% | |
| E Washingtn | 12% | 12% | 0% | 15.1 | 0% | 0% | |
| F Dickinson | 11% | 11% | 0% | 15.5 | 0% | 0% | |
| WI-Grn Bay | 11% | 11% | 0% | 14.1 | 0% | 0% | |
| Seattle | 11% | 11% | 0% | 13.7 | 0% | 0% | |
| CS Fullerton | 11% | 11% | 0% | 14.9 | 0% | 0% | |
| Middle Tenn | 11% | 8% | 3% | 11.5 | 0% | 0% | |
| N Illinois | 11% | 9% | 1% | 12.2 | 0% | 0% | |
| Jackson St | 11% | 11% | 0% | 15.9 | 0% | 0% | |
| Winthrop | 11% | 11% | 0% | 15.0 | 0% | 0% | |
| Central FL | 11% | 3% | 8% | 9.3 | 1% | 0% | |
| S Dakota St | 11% | 11% | 0% | 14.9 | 0% | 0% | |
| Texas State | 11% | 10% | 1% | 12.7 | 0% | 0% | |
| Charl South | 11% | 11% | 0% | 15.1 | 0% | 0% | |
| Kent State | 11% | 8% | 3% | 11.9 | 0% | 0% | |
| Cal St Nrdge | 10% | 10% | 0% | 14.8 | 0% | 0% | |
| Howard | 10% | 10% | 0% | 16.0 | 0% | 0% | |
| Lehigh | 10% | 10% | 0% | 14.4 | 0% | 0% | |
| Ste F Austin | 10% | 10% | 0% | 15.5 | 0% | 0% | |
| Houston Bap | 10% | 10% | 0% | 15.6 | 0% | 0% | |
| TX-San Ant | 10% | 8% | 2% | 11.6 | 0% | 0% | |
| Siena | 10% | 10% | 0% | 15.2 | 0% | 0% | |
| Wake Forest | 10% | 0% | 9% | 10.0 | 0% | 0% | |
| St Bonavent | 9% | 4% | 6% | 9.5 | 1% | 0% | |
| Boston U | 9% | 9% | 0% | 14.5 | 0% | 0% | |
| NJIT | 9% | 9% | 0% | 14.8 | 0% | 0% | |
| Wm & Mary | 9% | 9% | 0% | 14.3 | 0% | 0% | |
| NC A&T | 9% | 9% | 0% | 16.0 | 0% | 0% | |
| IPFW | 9% | 9% | 0% | 15.1 | 0% | 0% | |
| VA Tech | 9% | 1% | 8% | 8.8 | 1% | 0% | |
| Duquesne | 9% | 4% | 5% | 9.7 | 0% | 0% | |
| Monmouth | 9% | 9% | 0% | 15.2 | 0% | 0% | |
| Wash State | 9% | 2% | 7% | 9.1 | 1% | 0% | |
| New Orleans | 9% | 9% | 0% | 15.5 | 0% | 0% | |
| Portland St | 9% | 9% | 0% | 15.2 | 0% | 0% | |
| Alabama St | 8% | 8% | 0% | 16.0 | 0% | 0% | |
| Vanderbilt | 8% | 0% | 8% | 9.2 | 1% | 0% | |
| Bradley | 8% | 7% | 1% | 13.1 | 0% | 0% | |
| Princeton | 8% | 7% | 1% | 12.8 | 0% | 0% | |
| San Fransco | 8% | 2% | 6% | 9.5 | 0% | 0% | |
| American | 8% | 8% | 0% | 14.6 | 0% | 0% | |
| Central Mich | 8% | 7% | 1% | 12.5 | 0% | 0% | |
| Utah | 8% | 1% | 6% | 9.7 | 0% | 0% | |
| Evansville | 8% | 7% | 1% | 13.4 | 0% | 0% | |
| Miami (OH) | 8% | 6% | 2% | 12.0 | 0% | 0% | |
| Mt St Marys | 7% | 7% | 0% | 15.6 | 0% | 0% | |
| UAB | 7% | 6% | 1% | 12.2 | 0% | 0% | |
| Austin Peay | 7% | 7% | 0% | 14.1 | 0% | 0% | |
| App State | 7% | 7% | 0% | 13.3 | 0% | 0% | |
| LA Lafayette | 7% | 7% | 0% | 13.3 | 0% | 0% | |
| N Arizona | 7% | 7% | 0% | 15.4 | 0% | 0% | |
| Fairfield | 7% | 7% | 0% | 15.5 | 0% | 0% | |
| Nicholls St | 7% | 7% | 0% | 15.6 | 0% | 0% | |
| Valparaiso | 7% | 6% | 0% | 13.5 | 0% | 0% | |
| Central Ark | 7% | 7% | 0% | 15.6 | 0% | 0% | |
| Illinois St | 7% | 6% | 1% | 13.3 | 0% | 0% | |
| Columbia | 6% | 6% | 0% | 13.4 | 0% | 0% | |
| Coastal Car | 6% | 6% | 0% | 13.4 | 0% | 0% | |
| Abl Christian | 6% | 6% | 0% | 15.6 | 0% | 0% | |
| S Utah | 6% | 6% | 0% | 15.4 | 0% | 0% | |
| Lamar | 6% | 6% | 0% | 15.6 | 0% | 0% | |
| Loyola-MD | 6% | 6% | 0% | 14.8 | 0% | 0% | |
| Fla Gulf Cst | 6% | 6% | 0% | 15.0 | 0% | 0% | |
| UC Davis | 6% | 6% | 0% | 15.2 | 0% | 0% | |
| Old Dominion | 6% | 5% | 1% | 12.6 | 0% | 0% | |
| IUPUI | 6% | 6% | 0% | 14.6 | 0% | 0% | |
| TX A&M-CC | 6% | 6% | 0% | 15.7 | 0% | 0% | |
| Rob Morris | 6% | 6% | 0% | 15.7 | 0% | 0% | |
| Mercer | 6% | 5% | 1% | 13.1 | 0% | 0% | |
| North Dakota | 6% | 6% | 0% | 15.3 | 0% | 0% | |
| Mass Lowell | 6% | 6% | 0% | 14.9 | 0% | 0% | |
| Brown | 5% | 5% | 1% | 13.3 | 0% | 0% | |
| Army | 5% | 5% | 0% | 14.8 | 0% | 0% | |
| Sac State | 5% | 5% | 0% | 15.5 | 0% | 0% | |
| Coppin State | 5% | 5% | 0% | 16.0 | 0% | 0% | |
| Canisius | 5% | 5% | 0% | 15.6 | 0% | 0% | |
| Youngs St | 5% | 5% | 0% | 14.8 | 0% | 0% | |
| Montana St | 5% | 5% | 0% | 15.4 | 0% | 0% | |
| Boston Col | 5% | 0% | 5% | 9.6 | 0% | 0% | |
| Georgia St | 5% | 4% | 0% | 13.5 | 0% | 0% | |
| Ark Pine Bl | 5% | 5% | 0% | 16.0 | 0% | 0% | |
| Pepperdine | 5% | 2% | 3% | 10.1 | 0% | 0% | |
| Alcorn State | 5% | 5% | 0% | 16.0 | 0% | 0% | |
| Delaware | 5% | 5% | 0% | 14.8 | 0% | 0% | |
| Southern | 5% | 5% | 0% | 16.0 | 0% | 0% | |
| UC Riverside | 5% | 5% | 0% | 15.4 | 0% | 0% | |
| California | 5% | 1% | 4% | 10.1 | 0% | 0% | |
| TX El Paso | 5% | 4% | 1% | 12.5 | 0% | 0% | |
| Northwestern | 5% | 0% | 4% | 9.7 | 0% | 0% | |
| Dartmouth | 5% | 4% | 0% | 13.6 | 0% | 0% | |
| Lg Beach St | 5% | 5% | 0% | 15.3 | 0% | 0% | |
| Quinnipiac | 5% | 5% | 0% | 15.6 | 0% | 0% | |
| St Fran (NY) | 4% | 4% | 0% | 15.7 | 0% | 0% | |
| Longwood | 4% | 4% | 0% | 15.5 | 0% | 0% | |
| LA Monroe | 4% | 4% | 0% | 13.7 | 0% | 0% | |
| North Texas | 4% | 4% | 1% | 12.7 | 0% | 0% | |
| CS Bakersfld | 4% | 4% | 0% | 14.6 | 0% | 0% | |
| WI-Milwkee | 4% | 4% | 0% | 14.7 | 0% | 0% | |
| S Illinois | 4% | 4% | 0% | 13.8 | 0% | 0% | |
| James Mad | 4% | 4% | 0% | 14.9 | 0% | 0% | |
| UMKC | 4% | 4% | 0% | 14.8 | 0% | 0% | |
| Stanford | 4% | 1% | 3% | 9.5 | 0% | 0% | |
| Manhattan | 4% | 4% | 0% | 15.6 | 0% | 0% | |
| Geo Mason | 4% | 2% | 3% | 10.5 | 0% | 0% | |
| Maryland BC | 4% | 4% | 0% | 15.1 | 0% | 0% | |
| Marshall | 4% | 3% | 1% | 12.9 | 0% | 0% | |
| W Illinois | 4% | 4% | 0% | 15.5 | 0% | 0% | |
| SE Louisiana | 4% | 4% | 0% | 15.8 | 0% | 0% | |
| Colorado St | 4% | 3% | 1% | 11.9 | 0% | 0% | |
| Jksnville St | 4% | 4% | 0% | 14.7 | 0% | 0% | |
| AR Lit Rock | 4% | 3% | 0% | 13.9 | 0% | 0% | |
| Campbell | 3% | 3% | 0% | 15.5 | 0% | 0% | |
| TX-Pan Am | 3% | 3% | 0% | 14.8 | 0% | 0% | |
| Denver | 3% | 3% | 0% | 15.6 | 0% | 0% | |
| DePaul | 3% | 1% | 2% | 10.3 | 0% | 0% | |
| Utah Val St | 3% | 3% | 0% | 15.0 | 0% | 0% | |
| Drexel | 3% | 3% | 0% | 15.1 | 0% | 0% | |
| San Diego | 3% | 1% | 2% | 10.7 | 0% | 0% | |
| Navy | 3% | 3% | 0% | 15.1 | 0% | 0% | |
| Bryant | 3% | 3% | 0% | 15.8 | 0% | 0% | |
| E Michigan | 3% | 2% | 0% | 13.4 | 0% | 0% | |
| Idaho | 3% | 3% | 0% | 15.7 | 0% | 0% | |
| High Point | 3% | 3% | 0% | 15.7 | 0% | 0% | |
| Fla Atlantic | 3% | 2% | 0% | 13.5 | 0% | 0% | |
| Lafayette | 2% | 2% | 0% | 15.3 | 0% | 0% | |
| NC-Wilmgton | 2% | 2% | 0% | 15.1 | 0% | 0% | |
| St Peters | 2% | 2% | 0% | 15.8 | 0% | 0% | |
| TN Martin | 2% | 2% | 0% | 15.0 | 0% | 0% | |
| Jacksonville | 2% | 2% | 0% | 15.4 | 0% | 0% | |
| Morehead St | 2% | 2% | 0% | 15.0 | 0% | 0% | |
| Cal Poly | 2% | 2% | 0% | 15.5 | 0% | 0% | |
| Ohio | 2% | 2% | 0% | 13.7 | 0% | 0% | |
| Florida Intl | 2% | 2% | 0% | 13.9 | 0% | 0% | |
| Niagara | 2% | 2% | 0% | 15.8 | 0% | 0% | |
| Marist | 2% | 2% | 0% | 15.8 | 0% | 0% | |
| Idaho State | 2% | 2% | 0% | 15.7 | 0% | 0% | |
| Alab A&M | 2% | 2% | 0% | 16.0 | 0% | 0% | |
| Cleveland St | 2% | 2% | 0% | 15.2 | 0% | 0% | |
| W Carolina | 2% | 2% | 0% | 14.3 | 0% | 0% | |
| SE Missouri | 2% | 2% | 0% | 15.1 | 0% | 0% | |
| Santa Clara | 2% | 1% | 1% | 10.7 | 0% | 0% | |
| Holy Cross | 2% | 2% | 0% | 15.2 | 0% | 0% | |
| Wagner | 2% | 2% | 0% | 15.9 | 0% | 0% | |
| E Kentucky | 2% | 2% | 0% | 15.1 | 0% | 0% | |
| TN State | 2% | 2% | 0% | 15.0 | 0% | 0% | |
| Saint Louis | 2% | 1% | 1% | 11.5 | 0% | 0% | |
| Rice | 2% | 2% | 0% | 14.0 | 0% | 0% | |
| S Mississippi | 2% | 1% | 0% | 13.3 | 0% | 0% | |
| Miss Val St | 2% | 2% | 0% | 16.0 | 0% | 0% | |
| Geo Wshgtn | 2% | 1% | 1% | 11.1 | 0% | 0% | |
| Maryland ES | 2% | 2% | 0% | 16.0 | 0% | 0% | |
| NC-Asheville | 2% | 2% | 0% | 15.7 | 0% | 0% | |
| Kennesaw St | 1% | 1% | 0% | 15.5 | 0% | 0% | |
| Air Force | 1% | 1% | 0% | 13.0 | 0% | 0% | |
| Chattanooga | 1% | 1% | 0% | 14.5 | 0% | 0% | |
| Hartford | 1% | 1% | 0% | 15.6 | 0% | 0% | |
| Troy | 1% | 1% | 0% | 14.3 | 0% | 0% | |
| TN Tech | 1% | 1% | 0% | 15.1 | 0% | 0% | |
| Loyola Mymt | 1% | 0% | 1% | 11.0 | 0% | 0% | |
| E Illinois | 1% | 1% | 0% | 15.2 | 0% | 0% | |
| W Michigan | 1% | 1% | 0% | 14.4 | 0% | 0% | |
| Presbyterian | 1% | 1% | 0% | 15.8 | 0% | 0% | |
| St Josephs | 1% | 1% | 0% | 11.5 | 0% | 0% | |
| Elon | 1% | 1% | 0% | 15.7 | 0% | 0% | |
| Arkansas St | 1% | 1% | 0% | 14.8 | 0% | 0% | |
| Tulane | 1% | 0% | 0% | 11.4 | 0% | 0% | |
| Central Conn | 1% | 1% | 0% | 15.9 | 0% | 0% | |
| Maine | 1% | 1% | 0% | 15.6 | 0% | 0% | |
| Delaware St | 1% | 1% | 0% | 16.0 | 0% | 0% | |
| La Salle | 1% | 0% | 0% | 12.1 | 0% | 0% | |
| Stetson | 1% | 1% | 0% | 15.8 | 0% | 0% | |
| Cornell | 1% | 1% | 0% | 14.8 | 0% | 0% | |
| SC Upstate | 1% | 1% | 0% | 15.9 | 0% | 0% | |
| Binghamton | 1% | 1% | 0% | 15.8 | 0% | 0% | |
| Charlotte | 1% | 1% | 0% | 14.6 | 0% | 0% | |
| Incar Word | 1% | 1% | 0% | 15.9 | 0% | 0% | |
| N Hampshire | 0% | 0% | 0% | 15.7 | 0% | 0% | |
| NW State | 0% | 0% | 0% | 16.0 | 0% | 0% | |
| North Alabama | 0% | 0% | 0% | 0.0 | 0% | 0% | |
| E Carolina | 0% | 0% | 0% | 11.9 | 0% | 0% | |
| SIU Edward | 0% | 0% | 0% | 15.5 | 0% | 0% | |
| VA Military | 0% | 0% | 0% | 15.4 | 0% | 0% | |
| U Mass | 0% | 0% | 0% | 13.1 | 0% | 0% | |
| Pacific | 0% | 0% | 0% | 12.3 | 0% | 0% | |
| Fordham | 0% | 0% | 0% | 12.7 | 0% | 0% | |
| Citadel | 0% | 0% | 0% | 15.6 | 0% | 0% | |
| Wyoming | 0% | 0% | 0% | 15.5 | 0% | 0% | |
| Portland | 0% | 0% | 0% | 12.1 | 0% | 0% | |
| Chicago St | 0% | 0% | 0% | 16.0 | 0% | 0% | |
| San Jose St | 0% | 0% | 0% | 13.2 | 0% | 0% | |
| GA Tech | 0% | 0% | 0% | 0.0 | 0% | 0% | |
| Merrimack | 0% | 0% | 0% | 0.0 | 0% | 0% | |
| Detroit | 0% | 0% | 0% | 0.0 | 0% | 0% | |
| Florida A&M | 0% | 0% | 0% | 0.0 | 0% | 0% | |
| California Baptist | 0% | 0% | 0% | 0.0 | 0% | 0% |
Finally, here’s a quick reminder. If you haven’t checked out the rest of our projections, please do! They include:
College Basketball Projected Conference Standings. Projected conference records and full regular season records, plus win odds for both the conference regular season title and the postseason tournament.Bracketology Projections. Odds to make the NCAA tournament, plus projected seeding, and lots more details. (One of our faves is the Bracketology By Conference page.)NCAA Tournament Bracket Predictions. Round by round advancement odds, including probability of a team making the Sweet 16, making the Final Four, or winning the championship.
If you liked this post, please share it. Thank you! Twitter Facebook
NFL Football Pool Picks NFL Survivor Pool Picks NCAA Bracket Picks College Bowl Pool Picks College Football Pool Picks NFL Picks NBA Picks MLB Picks College Football Picks College Basketball Picks NFL Predictions NBA Predictions MLB Predictions College Football Predictions College Basketball Predictions NFL Spread Picks NBA Spread Picks MLB Spread Picks College Football Spread Picks College Basketball Spread Picks NFL Rankings NBA Rankings MLB Rankings College Football Rankings College Basketball Rankings NFL Stats NBA Stats MLB Stats College Football Stats College Basketball Stats NFL Odds NBA Odds MLB Odds College Football Odds College Basketball Odds A product ofTeamRankings BlogAboutTeamJobsContact
© 2005-2024 Team Rankings, LLC. All Rights Reserved. Statistical data provided by Gracenote.
TeamRankings.com is not affiliated with the National Collegiate Athletic Association (NCAA®) or March Madness Athletic Association, neither of which has supplied, reviewed, approved or endorsed the material on this site. TeamRankings.com is solely responsible for this site but makes no guarantee about the accuracy or completeness of the information herein.
Terms of ServicePrivacy Policy